
A Matter of Years
Long-term monitoring
Long-term monitoring
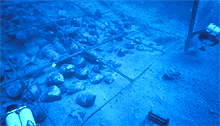 Quadrat used in underwater archaeology.
Image ©2000 Institute of Nautical Archaeology
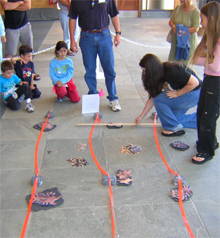 Kids learning about quadrats at the Ocean Institute.
Image from the Ocean Institute
All that you can do at OI
Change can take place over seasons, years, or even longer periods. Scientists who wish to observe this kind of change may not be able to put a time-lapse camera out in the field for such a long time.
To document change over longer time intervals, researchers use a tool called a photoquadrat. A photoquadrat is a rectangular marker of a known size that is placed in a fixed location over time. Photographs of the photoquadrat area are taken intermittently and then compared.
A photo preserves details that a person might not remember in detail. Comparisons of photos reveal longterm change. The rectangular marker ensures that the same area is being compared from time-to-time and that the actual dimensions and orientation of the area are known.
Longterm monitoring is important in order to get an idea of the full range of change that ecosystems might experience. A human lifetime may not be long enough to experience the full range of change that the natural word has in store for us. If we can anticipate the range of change, we can be prepared.
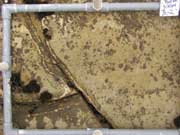 Tidepool photoquadrat sequence over 12 years.
A tide pool at Hollister Ranch, Santa Barbara County.
See the image sequence.
Images courtesy Pete Raimondi.
Because it takes so long and such persistence is required, it is remarkable that scientists such as Pete Raimondi make long term observations. Take a look at the sequence of tidepool images that Pete Raimondi took of a photoquadrat area in a rocky intertidal area near Santa Barbara, California.
Get a glimpse of ecosystem changes over 12 years. What might have caused these changes? If we didn't have these long term observations for comparison, we wouldn't be able to decide whether this ecosystem is in good health today or not.
Where to find more information:
Online quadrat count
Many times, there are too many individuals to count one-by-one. In addition to keeping track of location, the grid of a quadrat also helps to estimate numbers of individuals when the population is large, without counting each individual. Try your hand at fast-counting.
Earthguide for Sea Floor Science
Produced in collaboration with Scripps Institution of Oceanography.
Website by Earthguide.
© 2003-2004 by the Ocean Institute
and the Regents of the University of California.
All rights reserved.
Last modifed Monday, December 10, 2004